
Quality control tools identify defects early, streamline operations, and maintain customer satisfaction through systematic monitoring, statistical process control, and data-driven decision-making to ensure consistent product quality.
When it comes to quality control tools, you’re looking at essential instruments that can significantly impact your production processes. These tools help identify defects early, streamline operations, and maintain customer satisfaction. But how do these techniques actually work in practice? What specific methodologies and tools can you implement to ensure consistent quality? Let’s explore some of the most effective strategies and their applications.
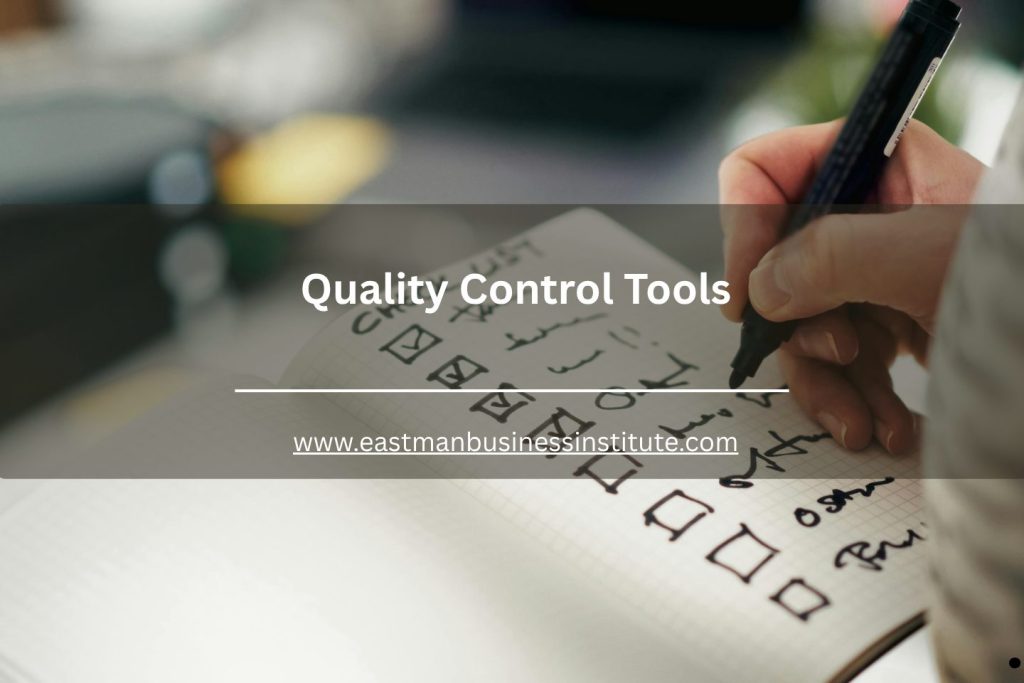
Understanding Quality Control
Quality control is the backbone of any successful production process. It ensures that your products meet specific standards and satisfy customer expectations.
By understanding quality control, you can identify potential issues before they escalate, saving time and resources. This process involves systematic monitoring and measuring of various stages in production. You’ll use defined criteria to evaluate products, ensuring consistency and reliability.
Effective quality control not only boosts customer satisfaction but also enhances your brand’s reputation. By fostering a culture of quality within your team, you empower everyone to take responsibility for their work. Implementing ISO 9000 standards can further enhance your quality management system, ensuring continuous improvement and customer focus.

Importance of Quality Control Tools
While you might think of quality control as merely a set of procedures, the tools you choose to implement it are crucial for success.
These tools help you identify defects, streamline processes, and enhance productivity. By utilizing effective quality control tools, you can pinpoint issues before they escalate, saving time and resources.
They also foster a culture of continuous improvement, empowering your team to take ownership of quality. Moreover, having the right tools enables you to make data-driven decisions, ensuring that your products meet customer expectations consistently. Additionally, effective utilization of quality tools is integral for driving excellence and delivering exceptional results.
Statistical Process Control (SPC)
Statistical Process Control (SPC) is a powerful method that helps you monitor and control processes through statistical techniques.
By using control charts, you can visualize data over time, making it easier to identify trends, shifts, or any abnormal variations. This proactive approach allows you to make informed decisions before issues escalate.
You’ll collect data from your processes, analyze it, and determine if they’re operating within designated limits. If you notice any outliers, you can investigate the root cause and take corrective actions promptly.
Implementing SPC not only improves quality but also enhances efficiency, reducing waste and costs. Embracing SPC can lead to a more consistent output and higher customer satisfaction, ensuring your processes run smoothly. Additionally, SPC aligns with the core principles of data-driven decision-making, ensuring that improvements are based on concrete evidence rather than assumptions.
Six Sigma Methodology
Six Sigma methodology is a data-driven approach that focuses on process improvement and variation reduction. By using statistical tools and techniques, you can identify and eliminate defects in your processes, leading to higher quality and greater customer satisfaction.
You’ll want to start by defining the problem you’re facing, then measure current performance to understand the extent of the issue. Analyzing data helps you identify root causes, and you can then improve processes by implementing targeted solutions.
Finally, controlling the new processes ensures that improvements are sustained over time. Embracing this methodology empowers you to enhance efficiency, reduce costs, and foster a culture of continuous improvement within your organization. Furthermore, the implementation of DMAIC methodology provides a structured framework for guiding your project through its various phases.
Control Charts
Control charts are essential tools in quality control that help you monitor process performance over time. By plotting data points over a specified period, you can easily identify trends, shifts, or any unusual variations in your processes.
You’ll typically use control limits—upper and lower boundaries that indicate acceptable performance levels. When your data points fall outside these limits, it signals the need for investigation. This allows you to take corrective actions before issues escalate.
Different types of control charts exist, such as X-bar and R charts, tailored for various data types. By regularly reviewing these charts, you can maintain consistent quality and improve overall process efficiency. Control charts are instrumental in achieving Six Sigma metrics, empowering you to make data-driven decisions, enhancing your quality management efforts.

Fishbone Diagram
While analyzing problems in a process, the Fishbone Diagram, also known as the Ishikawa or cause-and-effect diagram, serves as a powerful tool for identifying potential root causes.
You can easily create this diagram by drawing a central spine that represents the main issue, with branches extending out to categorize potential causes. These branches often include categories like people, processes, materials, and environment.
As you brainstorm, engage your team to ensure diverse perspectives are considered. This collaborative approach helps uncover hidden factors contributing to the problem.
Once you’ve identified the causes, you can prioritize them for further investigation. The Fishbone Diagram not only clarifies complex issues but also fosters teamwork and communication, leading to more effective problem-solving.
Pareto Analysis
After identifying potential root causes with the Fishbone Diagram, you can use Pareto Analysis to prioritize which issues to tackle first.
This technique helps you focus on the most significant problems that contribute to the majority of your issues. Begin by collecting data on the frequency or impact of each problem.
Then, create a bar chart to visualize these issues, with the tallest bars representing the most critical ones. You’ll often find that a small number of causes lead to a large percentage of problems—this is known as the 80/20 rule.
Quality Improvement Plans
To effectively enhance quality within your organization, establishing a Quality Improvement Plan is essential. This plan outlines specific goals, strategies, and timelines for improving processes and outcomes.
Start by identifying areas needing improvement based on data and feedback. Engage your team in brainstorming solutions and prioritizing initiatives that will have the most significant impact.
Next, set measurable objectives to track progress. Regularly review results and adjust your strategies as needed. Remember to communicate openly with your team, encouraging their involvement throughout the process.
Celebrate small wins to maintain motivation. By continuously refining your Quality Improvement Plan, you’ll foster a culture of excellence that drives sustainable growth and enhances customer satisfaction. Additionally, incorporating data-driven methodology into your approach can significantly enhance decision-making and project outcomes.
It’s a commitment to ongoing improvement that pays off in the long run.
Conclusion
Incorporating quality control tools into your processes can drastically enhance your production efficiency and product quality. By understanding and applying techniques like SPC, Six Sigma, and various analytical tools, you can identify and address issues early on. This not only saves time and resources but also fosters a culture of continuous improvement within your team. Ultimately, embracing these tools will help you meet customer expectations and strengthen your organization’s reputation for excellence.

Frequently Asked Questions
What Are Quality Control Tools?
Quality control tools are methods and techniques used to monitor, analyze, and improve processes, products, and services. These tools help organizations identify defects, reduce process variation, and maintain consistent quality standards across operations. Common examples include control charts, Pareto charts, fishbone diagrams, histograms, and check sheets.
Why Are Quality Control Tools Important?
Quality control tools are important because they help businesses improve efficiency, reduce waste, enhance customer satisfaction, and maintain compliance with quality standards. By identifying root causes of problems and monitoring performance trends, organizations can make better decisions and continuously improve operational processes.
What Are The Seven Basic Quality Control Tools?
The seven basic quality control tools include the cause-and-effect diagram, check sheet, control chart, histogram, Pareto chart, scatter diagram, and flowchart or stratification chart. These tools are widely used in quality management and process improvement because they simplify problem-solving and data analysis.
How Are Quality Control Tools Used In Process Improvement?
Quality control tools are used to collect data, identify trends, analyze defects, monitor performance, and implement corrective actions. Businesses often combine these tools with methodologies such as Lean, Six Sigma, and Statistical Process Control (SPC) to improve productivity and maintain consistent quality outcomes.
Which Industries Commonly Use Quality Control Tools?
Quality control tools are commonly used in manufacturing, healthcare, construction, logistics, food production, engineering, and service industries. Organizations across these sectors rely on quality management techniques to improve reliability, increase safety, reduce defects, and support continuous operational improvement.