In the pursuit of excellence, mastering the art of precision is key. An introduction to statistical analysis for six sigma provides a foundational gateway into the meticulous world of Six Sigma methodologies, where variance components analysis, control limits, and statistical measures transform raw data into actionable insights.
Statistical analysis for Six Sigma transforms raw data into actionable insights by applying variance components analysis, control limits, and measures of central tendency to drive quality control and process improvement. This foundational guide bridges theoretical knowledge with practical application, making it an essential resource for professionals aiming to reduce variability and enhance operational efficiency.
Designed for both burgeoning black belts and seasoned professionals, this article delves into how central tendencies and extensive research form the backbone of quality control and process improvement. By bridging the gap between theoretical knowledge and practical application, we decode the complexities of statistical analysis, making it an indispensable tool for anyone looking to enhance their analytical capabilities in a Six Sigma framework.
Read more about An Introduction to Statistical Analysis for Six Sigma
Whether you are compiling your first data set or refining your expertise, the journey into statistical analysis begins here, charting a course toward unparalleled quality and precision.
More Things To Know About An Introduction to Statistical Analysis for Six Sigma
Understanding Six Sigma
Understanding Six Sigma involves grasping its core objective: reducing variability to enhance process efficiency. Six Sigma is a methodology that relies on statistical analysis to identify and eliminate defects or variations within a process.
The purpose of Six Sigma is to improve the quality of outputs by minimizing errors and deviations, leading to increased customer satisfaction and reduced costs.
In Six Sigma projects, data-driven decision-making is crucial, as it helps in understanding the current state of processes, setting improvement goals, and measuring progress accurately.
By implementing Six Sigma strategies, organizations can streamline operations, optimize performance, and achieve consistent results.
Embracing Six Sigma principles empowers teams to tackle challenges systematically, driving continuous improvement and sustainable success.
History and Evolution of Six Sigma
The evolution of Six Sigma can be traced back to the mid-1980s when Motorola pioneered its development. Initially a quality improvement methodology, Six Sigma has evolved over the years to become a data-driven approach that emphasizes reducing defects and variation in processes.
Its history is deeply rooted in statistical analysis, where the goal is to achieve a level of quality that equates to only 3.4 defects per million opportunities. This approach relies on statistical tools and techniques to measure and analyze process performance, identify areas for improvement, and make data-driven decisions.
Understanding the history of Six Sigma provides insights into how it has become a widely adopted methodology for process improvement across various industries.
Key Principles of Six Sigma
Starting with a solid foundation in statistical analysis, delve deeper into the key principles of Six Sigma to enhance your understanding of this data-driven approach. Six Sigma focuses on quality improvements by reducing variability and defects in processes.
Statistical analysis plays a crucial role in Six Sigma by providing the tools and techniques necessary to measure, analyze, and improve processes effectively. By implementing Six Sigma methodologies, organizations can achieve higher levels of quality and customer satisfaction.
Understanding the core principles of Six Sigma, such as DMAIC and the focus on data-driven decision-making, will empower you to drive meaningful change and deliver consistent results in quality improvements within your organization.
Role of Statistical Analysis in Six Sigma
Statistical analysis plays a crucial role in Six Sigma as it provides the necessary tools to measure and analyze process performance.
We will discover how statistical analysis supports key Six Sigma principles by enabling data-driven decision-making and process improvement.
Understanding the importance of statistical analysis is essential for effectively implementing Six Sigma methodologies in your organization.
Importance of Statistical Analysis in Six Sigma
By employing statistical analysis, you enhance decision-making processes in Six Sigma projects. Understanding Six Sigma statistics like analysis of variance and process capability is crucial for identifying areas of improvement and making data-driven decisions.
Statistical analysis allows you to quantify variations, identify root causes of defects, and measure process performance accurately. By utilizing tools such as control charts, hypothesis testing, and regression analysis, you can ensure that process improvements are based on solid evidence rather than assumptions.
Process capability studies enable you to assess the capability of a process to meet specifications, ensuring that your solutions are effective and sustainable. Statistical analysis plays a vital role in Six Sigma by providing the foundation for making informed decisions and driving continuous improvement efforts.
How Statistical Analysis Supports Six Sigma Principles
To effectively implement Six Sigma principles, you need to rely on statistical analysis as a foundational tool for decision-making and continuous improvement. Statistical analysis plays a crucial role in Six Sigma by providing a systematic approach to measure process performance, identify areas for improvement, and make data-driven decisions.
By utilizing statistical tools such as control charts, regression analysis, and hypothesis testing, you can analyze process data to understand variation, detect trends, and validate solutions. This analytical approach ensures that improvements are based on evidence and not just intuition, leading to more effective problem-solving and sustainable results.
Statistical analysis in Six Sigma empowers organizations to optimize processes, reduce defects, and enhance overall performance to meet customer expectations and business objectives.
Basic Statistical Concepts for Six Sigma
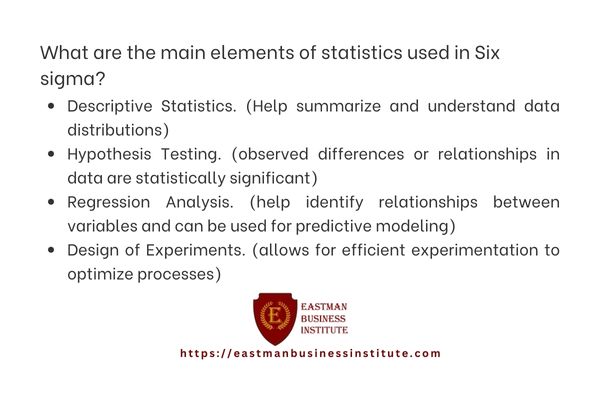
When starting to explore the basic statistical concepts for Six Sigma, you need to grasp key ideas like descriptive statistics (mean, median, mode, variance, and standard deviation), probability distributions (normal, binomial, and Poisson distributions), and hypothesis testing with confidence intervals.
Understanding these foundational concepts will lay a solid groundwork for your statistical analysis journey within the Six Sigma framework. Get ready to crunch numbers and make data-driven decisions using these essential statistical tools.
Descriptive Statistics: Mean, Median, Mode, Variance, and Standard Deviation
Understand the basic statistical concepts essential for Six Sigma by exploring mean, median, mode, variance, and standard deviation. Descriptive statistics provide a summary of data, with the mean being the average value, calculated by summing all values and dividing by the total count.
The median is the middle value when data is ordered, and the mode is the most frequently occurring value. Variance measures the spread of data points from the mean, while the standard deviation is the square root of the variance, offering a more interpretable measure of dispersion.
These statistical measures are crucial in Six Sigma methodologies to analyze process performance, identify variations, and make informed decisions for process improvement.
Probability Distributions: Normal, Binomial, and Poisson Distributions
Explore three key probability distributions – Normal, Binomial, and Poisson distributions – essential for Six Sigma methodologies to further analyze process performance and make informed decisions for process improvement.
The normal distribution, often referred to as the bell curve, is crucial in Six Sigma for understanding variation. It’s symmetrical, with the mean, median, and mode being equal.
The binomial distribution is used when dealing with two possible outcomes, like passing or failing. It helps determine probabilities in a fixed number of trials.
The Poisson distribution is valuable for rare events, estimating the number of occurrences in a fixed interval of time or space. Understanding these probability distributions is fundamental in the Six Sigma approach to enhancing processes and achieving quality improvements.
Hypothesis Testing and Confidence Intervals
Transitioning from probability distributions, you’ll now delve into hypothesis testing and confidence intervals as essential statistical concepts for Six Sigma methodology.
In Six Sigma statistics, hypothesis testing involves making decisions based on sample data to determine if there’s enough evidence to reject a null hypothesis. This process helps in drawing conclusions about a population based on sample data.
Confidence intervals, on the other hand, provide a range of values within which the true population parameter is likely to fall. They offer insight into the precision of estimates derived from sample data.
Understanding hypothesis testing and confidence intervals is crucial for ensuring the effectiveness of Six Sigma projects and making informed decisions based on statistical evidence.
Advanced Statistical Tools for Six Sigma
Regression Analysis helps you understand relationships between variables, while ANOVA assesses differences among group means.
The Chi-Square Test evaluates independence between categorical variables, and Design of Experiments (DOE) aids in optimizing processes.
Regression Analysis
When conducting Six Sigma projects, understanding the principles behind regression analysis is crucial for making data-driven decisions. Regression analysis is a powerful statistical tool within the Six Sigma methodology that allows you to explore the relationship between variables.
By utilizing regression analysis, you can identify key factors that influence process outcomes and make informed decisions to improve performance. This advanced statistical analysis technique helps predict future trends, understand the impact of process changes, and optimize processes for enhanced efficiency.
In Six Sigma projects, regression analysis plays a vital role in uncovering insights from data, enabling you to address root causes of variation and drive continuous improvement initiatives effectively. Mastering regression analysis is essential for conducting thorough statistical analysis in Six Sigma projects.
Analysis of Variance (ANOVA)
To perform an Analysis of Variance (ANOVA) in Six Sigma projects, you compare means of multiple groups to determine if there are statistically significant differences. ANOVA is a powerful statistical technique used in quality management and process improvement initiatives.
By analyzing variations between groups and within groups, ANOVA helps identify the sources of variation in a process. This analysis is crucial for understanding the factors that impact process performance and for making informed decisions to improve overall quality.
ANOVA complements other statistical process control tools and techniques by providing a deeper level of analysis of the data. It enables practitioners to assess the impact of different factors on process outcomes, leading to more effective problem-solving and continuous improvement efforts.
Chi-Square Test
Continuing from the previous subtopic on Analysis of Variance (ANOVA), as you delve deeper into statistical analysis for Six Sigma projects, the Chi-Square Test emerges as a critical tool for examining relationships between categorical variables.
This statistical tool is particularly useful when you need to determine if there’s a significant association between two categorical variables. By comparing observed frequencies with expected frequencies, the Chi-Square Test helps you assess whether any relationship exists or if the variables are independent.
In Six Sigma processes, understanding these relationships is vital for making informed decisions and improving overall efficiency. Utilizing the Chi-Square Test enhances your ability to analyze data accurately and draw meaningful insights that drive process improvements within the Six Sigma framework.
Design of Experiments (DOE)
As you progress from the Chi-Square Test, delve into the advanced statistical tool of Design of Experiments (DOE) for Six Sigma projects to optimize processes and enhance efficiency.
Design of Experiments is a systematic method to understand the relationship between inputs and outputs in an experiment. By carefully planning the experiment, varying inputs deliberately, and analyzing the results, you can identify the most critical factors affecting a process.
DOE helps in determining the optimal settings for process parameters, reducing variability, and achieving desired outcomes consistently. It allows you to study multiple factors simultaneously, leading to significant time and cost savings.
Implementing the Design of Experiments in your Six Sigma projects can result in data-driven decision-making and continuous improvement.
Six Sigma Methodologies
Let’s start by looking at the fundamental Six Sigma methodologies.
These include the DMAIC Methodology, DFSS Methodology, and lean six sigma Methodology.
Understanding these approaches is crucial for implementing Six Sigma practices effectively.
Define, Measure, Analyze, Improve, Control (DMAIC) Methodology
To effectively implement the DMAIC Methodology in Six Sigma projects, one must first understand its five key phases.
- Define: Clearly outline the problem, goals, and customer requirements to focus the project.
- Measure: Collect relevant data to quantify the current process performance.
- Analyze: Use statistical tools to identify the root causes of issues and understand process variations.
- Improve: Implement solutions to address root causes and optimize the process for enhanced performance.
Following these steps ensures a structured approach to problem-solving and process improvement in Six Sigma projects. By defining the project scope, measuring critical data, analyzing root causes, and implementing improvements, organizations can achieve significant quality enhancements and operational efficiencies.
Design for Six Sigma (DFSS) Methodology
The Design for Six Sigma (DFSS) Methodology in Six Sigma projects focuses on developing new processes or products that meet customer needs with minimal defects. This methodology emphasizes the importance of incorporating statistical analysis early in the design phase to ensure that the final product or process meets quality standards.
By utilizing statistical tools and techniques, DFSS aims to identify potential issues, analyze risks, and optimize designs to achieve high levels of performance and customer satisfaction. Unlike the DMAIC methodology, which focuses on improving existing processes, DFSS is proactive in designing processes right the first time.
Lean Six Sigma Methodology
Explore how Lean Six Sigma methodology streamlines processes by eliminating waste and improving efficiency in your organization. Lean Six Sigma combines the principles of lean manufacturing, focusing on waste reduction, and Six Sigma, emphasizing statistical analysis to enhance quality and reduce defects.
By integrating these methodologies, Lean Six Sigma aims to optimize operations, enhance customer satisfaction, and drive continuous improvement. Statistical analysis plays a crucial role in Lean Six Sigma, allowing organizations to identify the root causes of problems, make data-driven decisions, and monitor process performance effectively.
Through the systematic application of Lean Six Sigma tools and techniques, such as DMAIC (Define, Measure, Analyze, Improve, Control), companies can achieve higher productivity, lower costs, and increased profitability while delivering superior products or services.
Challenges and Solutions in Applying Statistical Analysis for Six Sigma
When it comes to applying statistical analysis in Six Sigma, you’ll encounter common challenges that can hinder your progress.
There are solutions and best practices that can help you overcome these obstacles.
Common Challenges in Applying Statistical Analysis
Navigating the common challenges in applying statistical analysis for Six Sigma can be a key factor in ensuring the successful implementation of quality improvement initiatives. Some common challenges you may encounter include difficulties in collecting accurate data for statistical analysis, interpreting complex statistical results, and effectively communicating findings to stakeholders.
To address these challenges, consider investing in proper data collection tools, providing training for team members on statistical analysis techniques, and utilizing data visualization tools to simplify communication. Ensuring that data is clean, relevant, and representative of the process under study is crucial for accurate statistical analysis in Six Sigma projects.
Solutions and Best Practices for Overcoming These Challenges
To address challenges in applying statistical analysis for Six Sigma, consider implementing data validation techniques. Ensuring the accuracy and integrity of your data is crucial for deriving meaningful insights.
Utilize tools like data cleaning and verification to eliminate errors and inconsistencies that may affect the statistical analysis process. Establish clear data collection procedures and conduct regular checks to maintain data quality throughout the project.
Employing robust statistical software can streamline the analysis process and provide accurate results. Collaborating with subject matter experts and conducting thorough training sessions on statistical techniques can enhance the team’s proficiency in applying statistical analysis for Six Sigma projects.
Future Trends in Statistical Analysis for Six Sigma
As we look ahead to the future of Statistical Analysis for Six Sigma, consider the impact of technological advancements like Big Data and Machine Learning.
Stay attuned to evolving business needs and how they intersect with the principles of Six Sigma.
The future landscape of Six Sigma and Statistical Analysis holds exciting potential for innovation and growth.
Technological Advancements: Big Data and Machine Learning
We can harness the power of big data and machine learning to propel the future of statistical analysis for Six Sigma. By leveraging these cutting-edge technologies, we can enhance statistical inference, optimize control charts, and effectively manage variability within our processes.
Big data allows you to analyze vast amounts of information to make informed decisions and predictions, while machine learning algorithms can identify patterns and trends that may not be apparent through traditional methods. This integration of big data and machine learning not only streamlines data analysis but also enables you to uncover hidden insights that can drive improvements in quality and efficiency.
Embracing these advancements will revolutionize how statistical analysis is conducted within the Six Sigma framework, offering new possibilities for enhancing performance and achieving organizational excellence.
Evolving Business Needs and Six Sigma
Businesses are increasingly demanding advanced statistical analysis techniques to meet the evolving requirements of Six Sigma methodologies. As organizations strive for efficiency and quality improvement, the integration of statistical analysis into business processes has become essential.
Six Sigma, a data-driven approach, relies heavily on statistical tools to identify areas for improvement, reduce variation, and enhance overall performance. By leveraging statistical analysis, businesses can gain valuable insights into their processes, enabling informed decision-making and targeted problem-solving.
The application of statistical methods in Six Sigma not only aids in achieving operational excellence but also fosters a culture of continuous improvement within an organization. Embracing statistical analysis as a core component of Six Sigma empowers businesses to drive meaningful change and stay competitive in today’s dynamic market landscape.
The Future of Six Sigma and Statistical Analysis
Continuing the evolution of statistical analysis in Six Sigma, future trends emphasize the integration of advanced analytics for enhanced performance. The future of Six Sigma and statistical analysis lies in the utilization of cutting-edge statistical methods to drive continuous improvement.
Six Sigma practitioners are increasingly turning to sophisticated tools like machine learning and artificial intelligence to extract insights from complex data sets. These advanced statistical methods enable organizations to uncover hidden patterns, optimize processes, and make data-driven decisions more effectively.
Frequently Asked Questions
How Can Businesses Ensure the Accuracy and Reliability of Data Used in Statistical Analysis for Six Sigma?
To ensure the accuracy and reliability of data for statistical analysis in Six Sigma, you must validate sources, employ data verification techniques, and establish data quality standards. Consistent monitoring and periodic audits are essential.
What Are Some Common Pitfalls to Avoid When Implementing Statistical Analysis for Six Sigma in a Real-World Business Setting?
When implementing statistical analysis for Six Sigma in a real-world business setting, avoid common pitfalls like inadequate data preparation, overlooking assumptions, neglecting stakeholder involvement, and failing to continuously monitor and adapt processes.
How Can Organizations Ensure That Employees Are Properly Trained in Statistical Analysis Techniques for Six Sigma?
Ensure employees are properly trained in statistical analysis techniques for Six Sigma by offering comprehensive training programs, hands-on workshops, and continuous support. Encourage participation, provide resources, and promote a culture of learning and improvement.
Are There Any Emerging Technologies or Tools That Are Revolutionizing Statistical Analysis for Six Sigma?
Explore emerging technologies like AI, machine learning, and advanced analytics that are revolutionizing statistical analysis for Six Sigma. These tools enhance efficiency, accuracy, and decision-making, offering new possibilities for process improvement and quality control.
What Are Some Innovative Ways That Companies Are Using Statistical Analysis for Six Sigma to Drive Continuous Improvement and Innovation in Their Processes?
To drive continuous improvement and innovation in processes, companies leverage statistical analysis for Six Sigma by using data-driven decision-making, identifying root causes of issues, optimizing processes, and implementing predictive analytics for proactive problem-solving, enhancing overall efficiency and quality.
| Related Term | Definition |
|---|---|
| Bar Chart | A graphical representation of data using bars of different heights. |
| Book | A written or printed work consisting of pages bound together. |
| Central Tendency | A statistical measure that identifies a single value as representative of an entire distribution. |
| Generative AI | Artificial intelligence that can generate content, such as text, images, or music, by learning from a set of data. |
| Improve and Control | Phases of the Six Sigma process aimed at implementing solutions and maintaining improvements over time. |
| Six Sigma Program | A methodological approach to performance improvement that seeks to reduce variability in processes and increase quality. |
| Process Variables | Factors within a process that can be adjusted and controlled to affect outcomes in a predictable manner. |
| Product Quality | The degree to which a product or service meets customer expectations and requirements. |
| Elements of Statistics | Fundamental concepts and techniques used in collecting, analyzing, interpreting, and presenting data. |
| Capability Analysis | A statistical technique used to assess the ability of a process to meet specified limits or requirements. |