
A spaghetti diagram is a visual tool that maps the flow of materials or information to identify inefficiencies and streamline workflows, leading to improved productivity and process optimization.
Have you ever noticed how workflows can become tangled and inefficient over time? A Spaghetti Diagram can help you visualize the flow of materials and information in your workspace. By mapping out these paths, you can identify redundancies and areas needing improvement. But how do you create one effectively? Understanding the process and tools involved can lead to significant enhancements in your operations. Let's explore what it takes to develop a clear and impactful Spaghetti Diagram.
What Is a Spaghetti Diagram?
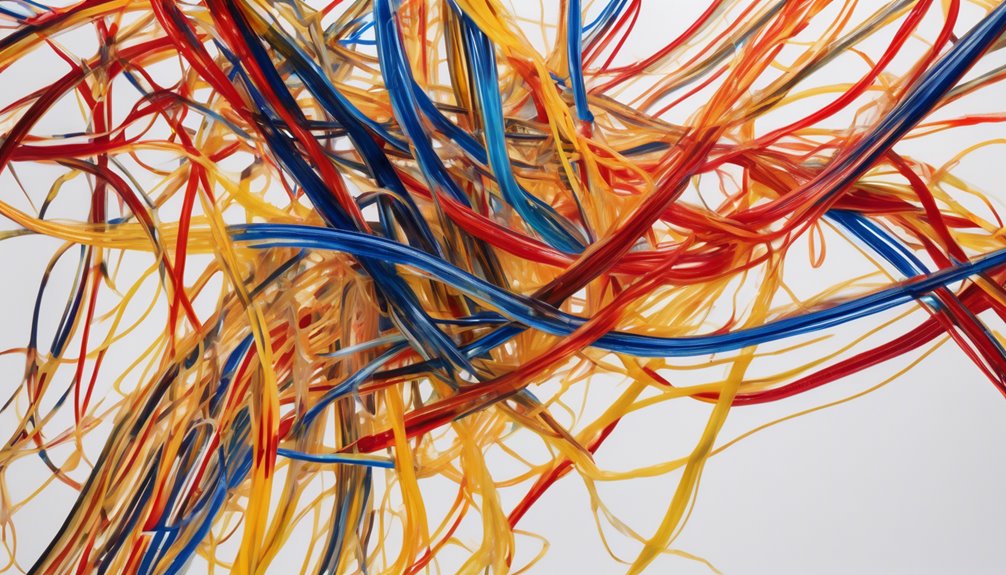
A spaghetti diagram is a visual tool that helps you map out the flow of materials or information in a process. You draw it by tracing lines that represent the movement of items or information from one point to another, creating a tangled web that resembles spaghetti.
This diagram highlights inefficiencies, redundancies, and areas for improvement in your workflow. By using various colors or symbols, you can distinguish different elements, such as employees, equipment, or inventory.
When you analyze the diagram, it becomes easier to identify bottlenecks or unnecessary steps. Ultimately, a spaghetti diagram provides a clear, visual representation of your process, making it a valuable resource for streamlining operations and enhancing productivity.
Purpose and Benefits of Spaghetti Diagrams
Understanding the purpose and benefits of spaghetti diagrams can significantly enhance your process improvement efforts. These visual tools help you identify inefficiencies in workflows by mapping out the movement of materials and information. By highlighting unnecessary steps and distances, you can spot areas for improvement.
Spaghetti diagrams promote better communication among team members, as they provide a clear visual representation of processes. They also foster collaboration by encouraging discussions around workflow optimization.
Moreover, using these diagrams can lead to reduced waste, increased productivity, and a more streamlined operation. Ultimately, by implementing spaghetti diagrams, you'll gain valuable insights that can drive meaningful changes in your organization, making processes more efficient and effective.
Steps to Create a Spaghetti Diagram

Creating a spaghetti diagram starts with gathering all relevant information about the process you want to analyze. Identify the key steps involved, the flow of materials, and the movement of people.
Next, map out the layout of your workspace or area where the process occurs. Use a large sheet of paper or a digital tool to sketch the layout.
Then, draw lines to represent the paths taken by materials and individuals. Make sure to include all movements, even those that seem minor.
Afterward, review your diagram for any unnecessary complexities. Finally, analyze the flow to pinpoint areas for improvement. This visual representation helps you see inefficiencies and streamline processes effectively.
Tools for Creating Spaghetti Diagrams
When it comes to crafting an effective spaghetti diagram, selecting the right tools can make all the difference. You'll find several options available, ranging from simple paper and colored markers to specialized software.
If you prefer a hands-on approach, grab a large sheet of paper and use different colored pens to represent various paths. Alternatively, digital tools like Lucidchart, Microsoft Visio, or Miro offer user-friendly interfaces that can streamline the process.
These programs often come with templates, allowing you to visualize your ideas quickly. Choose what fits your style best—whether it's tactile or digital—and start mapping out the flow of your process. The right tools will help you create a clearer, more impactful spaghetti diagram.
Analyzing Your Spaghetti Diagram
After you've crafted your spaghetti diagram, it's time to analyze it for insights. Start by looking for patterns and trends in the flow of information or materials. Are there any bottlenecks or redundancies that jump out at you? Identifying these areas can lead to improved efficiency.
Next, assess the connections between different elements. Are there unnecessary loops or overly complicated paths? Simplifying these can streamline processes.
Also, pay attention to the overall balance of your diagram—does it reflect a logical flow?
Finally, gather feedback from team members who interact with these processes. Their perspectives can reveal blind spots and lead to actionable solutions. Use these insights to refine your practices and enhance productivity.
Case Studies: Success Stories With Spaghetti Diagrams
While many organizations have implemented spaghetti diagrams, a few stand out for their remarkable transformations. One manufacturing company reduced its product assembly time by 30% after mapping out its workflow. By identifying unnecessary steps and bottlenecks, they streamlined operations, boosting efficiency and saving costs.
Another case involved a healthcare facility that used spaghetti diagrams to optimize patient flow. By visualizing movement between departments, they managed to cut down patient wait times significantly, leading to higher satisfaction scores.
In a retail environment, a store used spaghetti diagrams to analyze customer traffic patterns, resulting in a 20% increase in sales after reorganizing product placement.
These success stories highlight how effective spaghetti diagrams can be in driving meaningful change.
Common Mistakes to Avoid When Using Spaghetti Diagrams

Although spaghetti diagrams can be powerful tools for visualizing workflows, users often make common mistakes that undermine their effectiveness. One major pitfall is overcrowding your diagram with too much information. Keep it simple; focus on key processes to avoid confusion.
Additionally, neglecting to use consistent symbols or colors can lead to misinterpretation. Make sure you standardize your visual elements for clarity.
Another mistake is failing to involve team members in the creation process. Their insights can provide valuable context and help identify bottlenecks.
Lastly, don't skip the review phase; regularly revisit and update your diagram to reflect changes. By avoiding these mistakes, you'll create clearer, more actionable spaghetti diagrams that genuinely enhance your workflow understanding.
Conclusion
In conclusion, a Spaghetti Diagram is an invaluable tool for visualizing and optimizing workflows. By mapping out the flow of materials and information, you can pinpoint inefficiencies and streamline processes. Remember to analyze your diagrams thoughtfully and avoid common pitfalls to maximize their effectiveness. Whether you're looking to improve communication or boost productivity, using Spaghetti Diagrams can lead to significant improvements in your workspace. So, dive in and start transforming your operations today!