


Unimodal skewed right distributions cluster most data on the left with a longer tail to the right, where the mean exceeds the median. This shape is common in real-world data like income or age, making it essential for accurate analysis and decision-making.
When you encounter unimodal skewed right distributions, you’ll notice that most data points cluster on the left, with a longer tail stretching to the right. This shape can significantly affect your analysis, especially if you’re relying on measures of central tendency. Understanding how these distributions function is vital for making informed decisions. But what happens when you need to interpret the data effectively? Let’s explore the implications further.
Understanding Unimodal Distributions
When you explore unimodal distributions, you’ll notice they feature a single peak, making them easier to analyze compared to multimodal distributions. This singular peak indicates that most of the data points cluster around a central value.
You can visualize this with a bell-shaped curve, where the highest point represents the mode. Unimodal distributions often arise in real-world scenarios, like test scores or heights, where most individuals fall around a typical value.
To understand these distributions better, you’ll want to look at measures of central tendency, like the mean and median, which generally align closely.
Recognizing the shape and characteristics of unimodal distributions will significantly enhance your data analysis skills, enabling clearer insights into the underlying trends.

Characteristics of Skewed Right Distributions
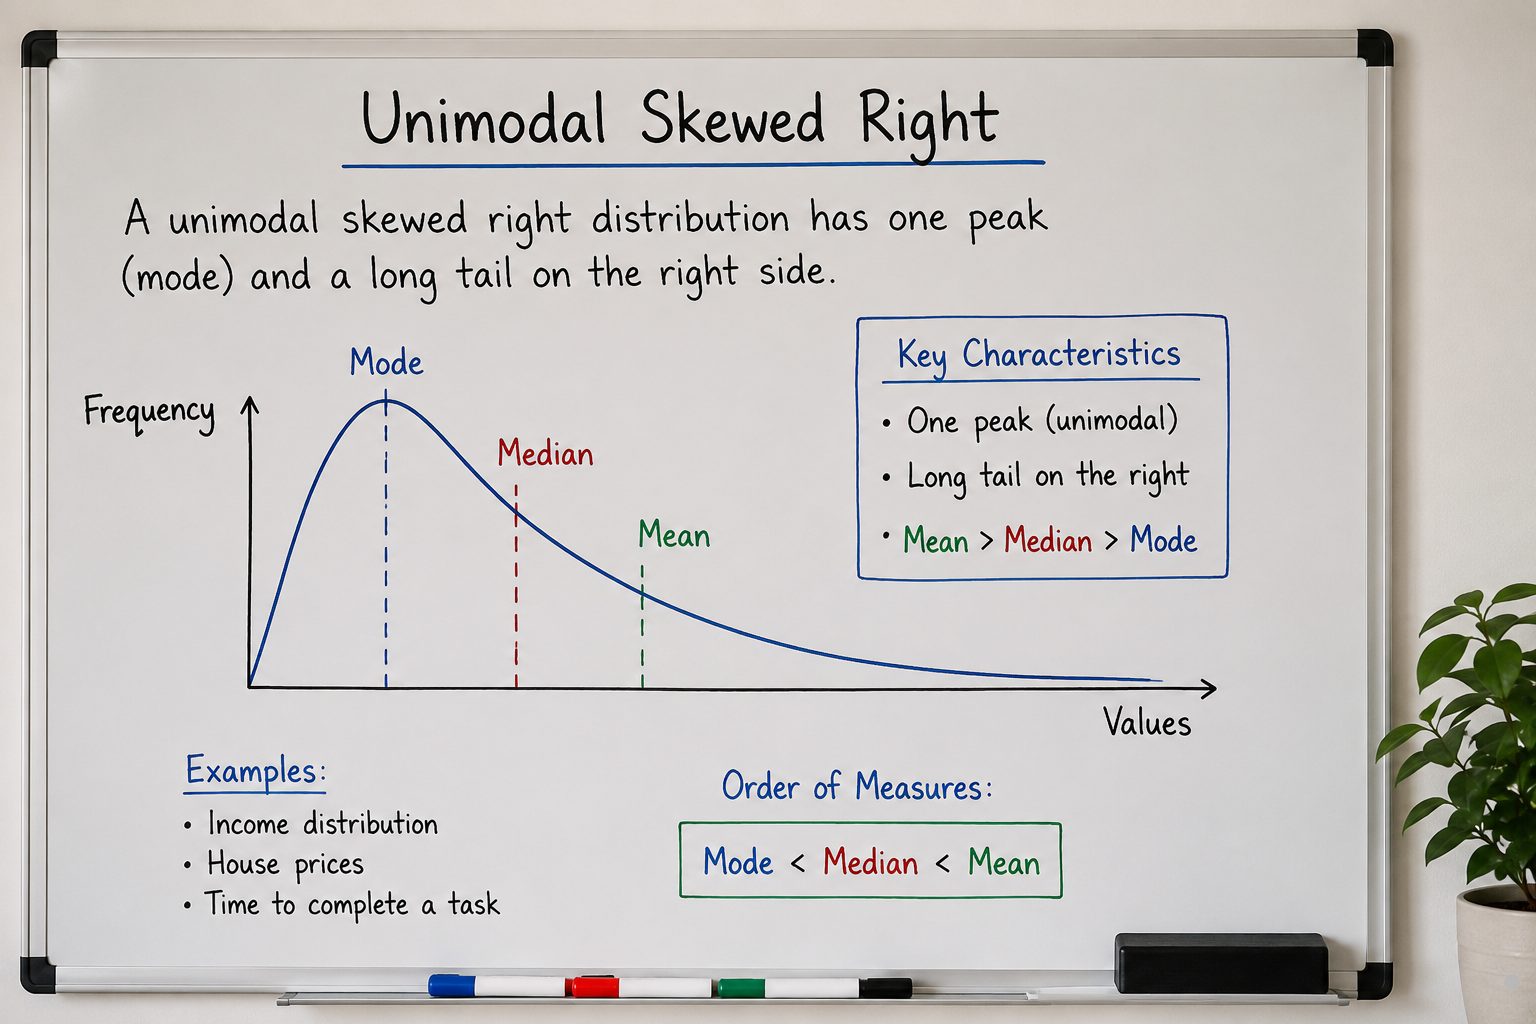
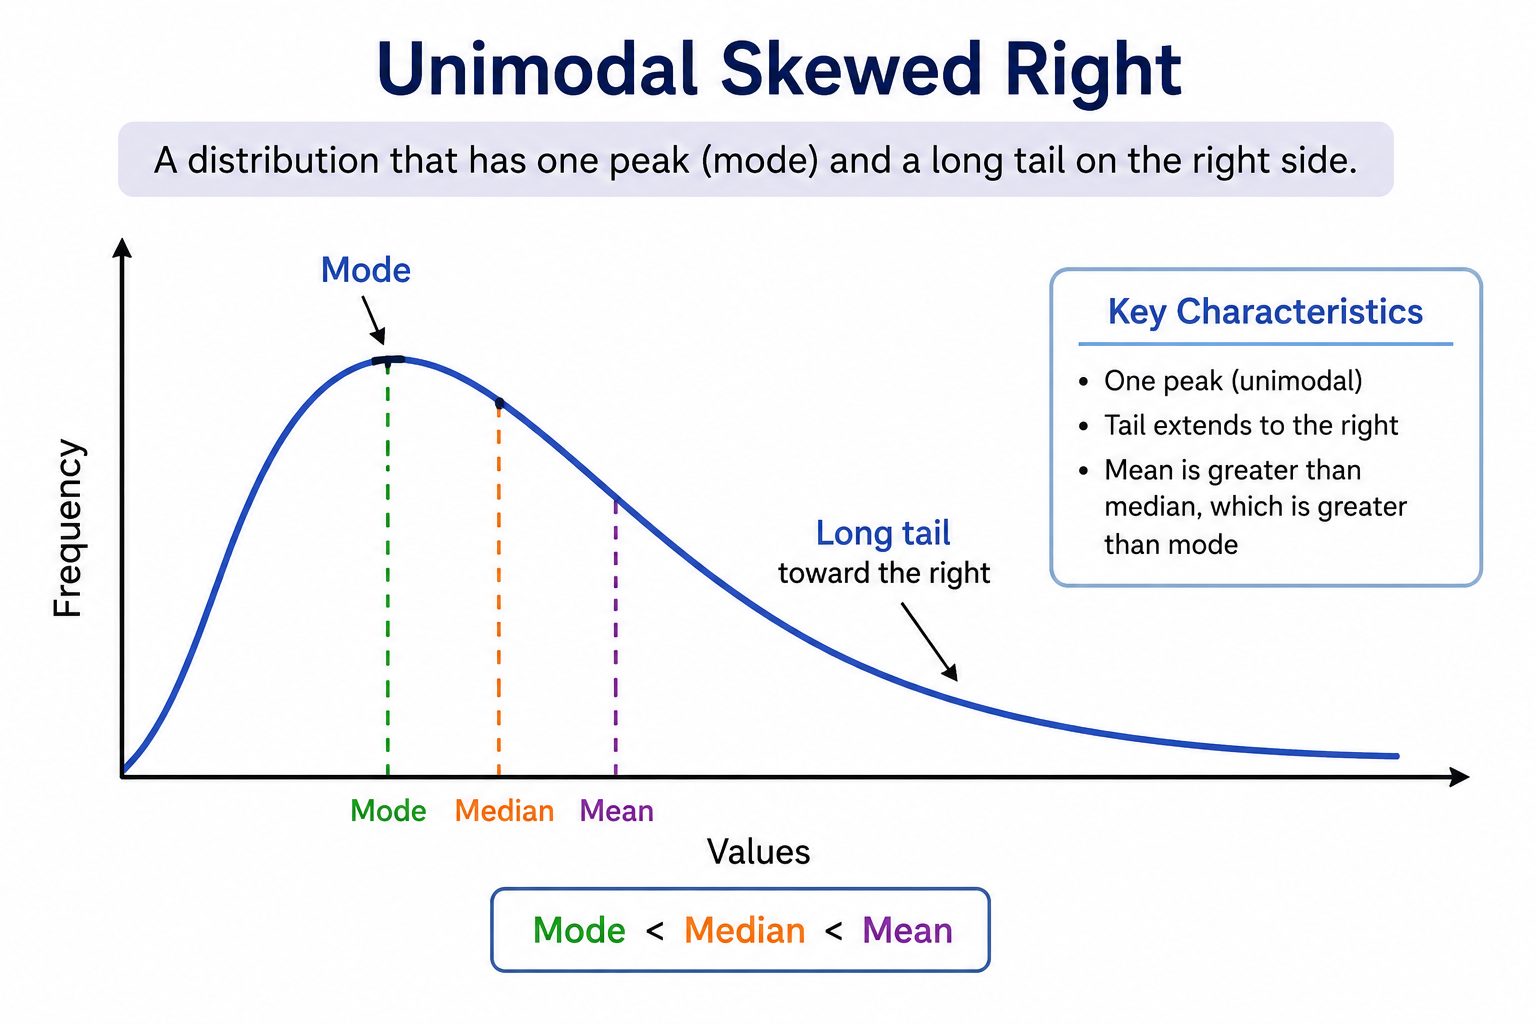
Unimodal distributions can also exhibit skewness, and one common type is a right-skewed distribution. In these distributions, most data points cluster on the left, with a long tail stretching to the right. This means you’ll often find lower values dominating while higher values are less frequent.
The mean tends to be greater than the median, as the tail pulls the average higher. You’ll notice that the mode, or the peak of the distribution, appears at the lower end, reflecting the concentration of values.
Additionally, right-skewed distributions often arise in real-world scenarios like income or age data, where a small number of higher values can significantly influence the overall shape. Understanding these characteristics helps you interpret data effectively.
Identifying Unimodal Skewed Right Distributions
To effectively identify unimodal skewed right distributions, you should look for specific characteristics in your data. First, check for a single peak or mode, indicating that most values cluster around a central point.
Next, observe the tail of the distribution; it should extend towards the right, showing that higher values are less frequent but present. You can also analyze the mean and median; in skewed right distributions, the mean will typically be greater than the median.
A histogram or box plot can provide visual confirmation of these traits. Lastly, applying statistical tests for skewness can further validate your findings, ensuring that your data truly exhibits a unimodal skew to the right.
Real-World Examples and Applications
Recognizing the characteristics of unimodal skewed right distributions can help you better understand their presence in real-world scenarios.
For instance, consider income levels in a region. Most people earn modest salaries, but a few individuals with very high incomes create a right skew.
Similarly, you might see this pattern in product sales, where a few bestsellers significantly outpace the rest.
In healthcare, patient recovery times often show this skew, as most patients recover quickly while a few take much longer.
Even in education, test scores can reflect this distribution, with many students scoring around the average and a few exceptional performers achieving high marks.
Implications for Data Analysis and Decision Making
Understanding the implications of unimodal skewed right distributions is crucial for effective data analysis and decision making. When you encounter this type of data, it’s important to recognize that the mean will typically be higher than the median. This can lead you to make decisions based on averages that don’t accurately reflect the majority of your data.
You should also consider the potential for outliers, as they can significantly influence your results. By applying appropriate statistical techniques, like using median over mean for central tendency, you can gain clearer insights.
Ultimately, acknowledging these characteristics helps you interpret data more accurately and facilitates better decision-making in your business or research endeavors.
Conclusion
In conclusion, recognizing unimodal skewed right distributions is essential for accurate data analysis. Since these distributions have a single peak with a long right tail, they can mislead you if you only focus on the mean. Instead, relying on the median gives you a clearer picture of the data’s central tendency. By understanding these characteristics, you can make more informed decisions and interpretations in your analyses, ultimately leading to better outcomes in various applications.
Frequently Asked Questions
What does unimodal skewed right mean in statistics?
A unimodal skewed right distribution is a dataset with one clear peak (mode) and a long tail extending toward the right side. This type of distribution indicates that most values are concentrated on the lower end, while a smaller number of unusually high values stretch the distribution to the right.
How can a right-skewed distribution be identified?
A right-skewed distribution can be identified by observing a long tail on the right side of a graph or histogram. In this distribution, the mean is typically greater than the median because extreme high values pull the average upward.
What is the relationship between mean, median, and mode in a unimodal skewed right distribution?
In a unimodal skewed right distribution, the mode is usually the smallest measure, followed by the median, while the mean is the largest. This relationship is commonly expressed as Mode < Median < Mean.
What are examples of unimodal skewed right data in real life?
Examples of unimodal skewed right data include income distribution, housing prices, healthcare costs, and test scores where a few unusually high values create a longer tail on the right side of the distribution.
Why is understanding skewness important in data analysis?
Understanding skewness is important because it helps analysts interpret data accurately, choose appropriate statistical methods, and identify outliers or unusual patterns. Recognizing skewed distributions also improves decision-making in research, finance, business, and quality management.