
When analyzing data, understanding skewness is key, especially when it comes to right-skewed and left-skewed distributions. You might notice that one type often shows a cluster of values on one side, which can significantly impact your conclusions. The implications of these differences aren't always obvious, yet they can guide your decisions. So, how do you identify these patterns, and what do they mean for your analysis? Let's explore further.
Understanding Skewness in Data Distributions

When you analyze data distributions, understanding skewness is crucial because it reveals how values spread around the mean. Skewness indicates the asymmetry of the data.
If you have a right-skewed distribution, most values cluster on the left, with a tail extending to the right. Conversely, in a left-skewed distribution, values pile up on the right, and the tail stretches to the left.
Recognizing these patterns helps you interpret data trends, identify outliers, and make informed decisions. By evaluating skewness, you can better understand the underlying characteristics of your dataset.
This knowledge enhances your ability to apply the right statistical methods and effectively communicate your findings. Always consider skewness when working with any dataset to ensure accurate analysis.
Characteristics of Right-Skewed Distributions
Right-skewed distributions, often seen in real-world data, have distinct characteristics that set them apart.
You'll notice that the tail on the right side is longer than the left, indicating that a few high values pull the mean to the right. In this type of distribution, the mean is greater than the median, illustrating how those extreme values influence the average.
Most of the data points cluster on the left, creating a peak that represents the mode. Common examples include income levels and certain test scores, where a small number of individuals significantly exceed the average.
Recognizing these traits can help you better analyze and interpret skewed data, making informed decisions based on the underlying distribution.
Characteristics of Left-Skewed Distributions

Left-skewed distributions present a contrasting picture to their right-skewed counterparts. In these distributions, you'll notice that the tail extends further to the left, indicating a concentration of data points on the higher end.
This means most values cluster around the higher range, while a few low values pull the mean down. When you look at the median, you'll often find it's greater than the mean, highlighting the impact of those lower outliers.
In practical terms, if you're analyzing left-skewed data, you might see decreased scores or values with a few significant low extremes. Understanding this characteristic helps you interpret data accurately, leading to better insights and decisions based on the distribution's shape.
Identifying Skewness in Real-World Data
To identify skewness in real-world data, you can start by visually inspecting the distribution through histograms or box plots.
Look for asymmetry in the data; if the tail on the right side is longer or fatter, you're likely dealing with right skewness. Conversely, a longer left tail indicates left skewness.
You can also calculate skewness coefficients using software or statistical tools. A skewness value close to zero suggests a symmetrical distribution, while positive values indicate right skewness, and negative values suggest left skewness.
Additionally, consider the mean and median; in right-skewed data, the mean typically exceeds the median.
Implications of Right Skewness in Decision Making

Understanding skewness in data isn't just an academic exercise; it has real implications for decision-making. When you're faced with right-skewed data, it often indicates that a few high values are driving the average up. This can mislead you if you rely solely on the mean for insights.
For instance, in sales data, a couple of exceptional sales can distort your perception of overall performance. Instead, consider the median for a clearer picture of central tendency.
This skewness may also affect risk assessment; high outliers can create an illusion of stability. By recognizing right skewness, you can make more informed decisions, adjust strategies, and allocate resources more effectively, ensuring you don't overlook underlying trends that matter.
Implications of Left Skewness in Data Analysis
While data analysis often focuses on average values, the implications of left skewness shouldn't be overlooked. When you encounter left skewness, it typically indicates that a significant portion of your data falls below the mean, hinting at potential outliers or anomalies.
This can skew your results and lead you to make incorrect conclusions if you rely solely on averages. It's crucial to consider the median and mode alongside the mean to gain a clearer picture.
Moreover, left skewness may suggest that you're dealing with a ceiling effect, where higher values are constrained. By acknowledging these aspects, you can make more informed decisions and better understand the true nature of your data.
Visualizing Skewness: Graphical Representations
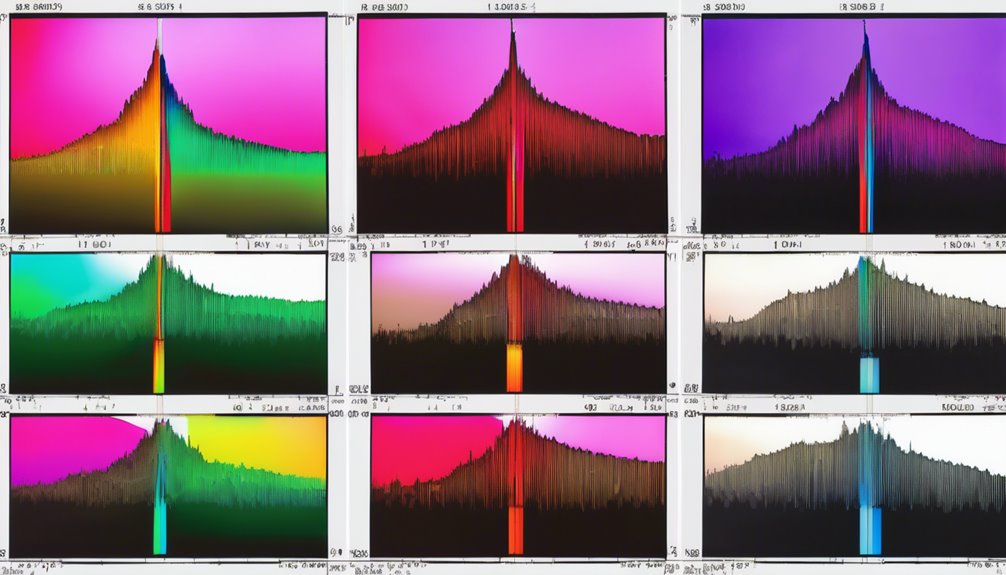
When you visualize skewness in data, graphical representations can offer powerful insights into its distribution. Histograms and box plots are particularly useful.
A right-skewed histogram will show a longer tail on the right, indicating that most data points cluster on the left. In contrast, a left-skewed histogram has a longer tail on the left, with data points concentrated on the right.
Box plots can also highlight skewness; the median will shift towards the tail. By examining these visual tools, you can quickly assess the symmetry of your data.
Identifying skewness helps you understand potential biases, guiding your analysis for better decision-making. Embrace these visuals to enhance your data interpretation skills.
Conclusion
In conclusion, understanding skewness in data distributions is essential for accurate analysis. Right-skewed distributions, with their longer tails to the right, can mislead conclusions if not properly identified, while left-skewed distributions can obscure higher-value concentrations. By recognizing these characteristics, you can make informed decisions and draw meaningful insights from your data. Ultimately, visualizing skewness helps clarify these differences, ensuring you're equipped to interpret trends and patterns effectively.