
Left and right skewed distributions describe how data clusters around the mean, with left skew showing a longer tail on the left and right skew showing a longer tail on the right, which affects key statistical measures and data interpretation.
When you analyze data distributions, understanding skewness is key. Left skewed and right skewed distributions reveal how data points cluster and where outliers lie. Recognizing these patterns can influence your conclusions significantly. You might wonder how these characteristics can impact your analysis and decision-making. Let's explore the nuances of each distribution and see how they shape the way you interpret data.
Understanding Skewness in Data Distributions

When you analyze data distributions, understanding skewness is crucial because it reveals how data points are spread around the mean.
Skewness indicates whether your data leans towards the left or right of the average. A positive skew means that the tail on the right side is longer or fatter, while a negative skew indicates a longer or fatter tail on the left.
Recognizing these patterns helps you interpret your data more accurately, as skewness affects statistical measures like the mean, median, and mode. If you grasp skewness, you can make better predictions and decisions based on your data.
It also guides you in choosing the right statistical tests, ensuring your analyses are valid and insightful.
Characteristics of Left Skewed Distributions
Left skewed distributions, also known as negatively skewed distributions, have distinct characteristics that set them apart.
In these distributions, you'll notice that the tail on the left side is longer or fatter than the right. This indicates that a majority of the data points cluster on the higher end, while a few lower values pull the mean down. As a result, the mean is typically less than the median, which you can use to identify the skewness.
Additionally, the mode, or the most frequently occurring value, often lies to the left of both the median and the mean. Understanding these characteristics helps you interpret data more effectively in various fields, from economics to education.
Identifying Left Skewed Distributions
To identify left skewed distributions, you should look for specific patterns in the data.
One key indicator is the tail, which extends longer on the left side, while the bulk of the data clusters on the right. You'll notice that the mean is typically less than the median, as the lower values pull the average downward.
Another clue is the presence of outliers on the lower end, which can further influence the distribution's shape.
Visual tools, like histograms or box plots, can help reveal these patterns clearly.
When you spot these characteristics, you can confidently categorize the distribution as left skewed, allowing for more accurate data interpretation and analysis in your work.
Characteristics of Right Skewed Distributions
Identifying a right skewed distribution involves recognizing several distinct features.
First, you'll notice that the majority of the data points cluster on the left side of the distribution, with fewer points trailing off to the right. This tail on the right indicates that some values are significantly higher than the rest.
Additionally, the mean of a right skewed distribution is typically greater than the median, as those extreme values pull the average upward. The mode, on the other hand, often sits to the left of both the median and mean.
Lastly, the distribution might exhibit a peak that quickly drops off, creating an asymmetrical appearance. Understanding these characteristics helps you better analyze and interpret right skewed data effectively.
Identifying Right Skewed Distributions

When you're looking to identify a right skewed distribution, pay attention to the shape of the data.
You'll notice that most values cluster on the left side, with a long tail stretching to the right. This tail indicates that there are a few exceptionally high values that pull the mean to the right of the median.
To confirm this skewness, compare the mean, median, and mode; in a right skewed distribution, the mean will be greater than the median, which in turn is greater than the mode.
Additionally, look for outliers in the higher range, as they often contribute to the skewness.
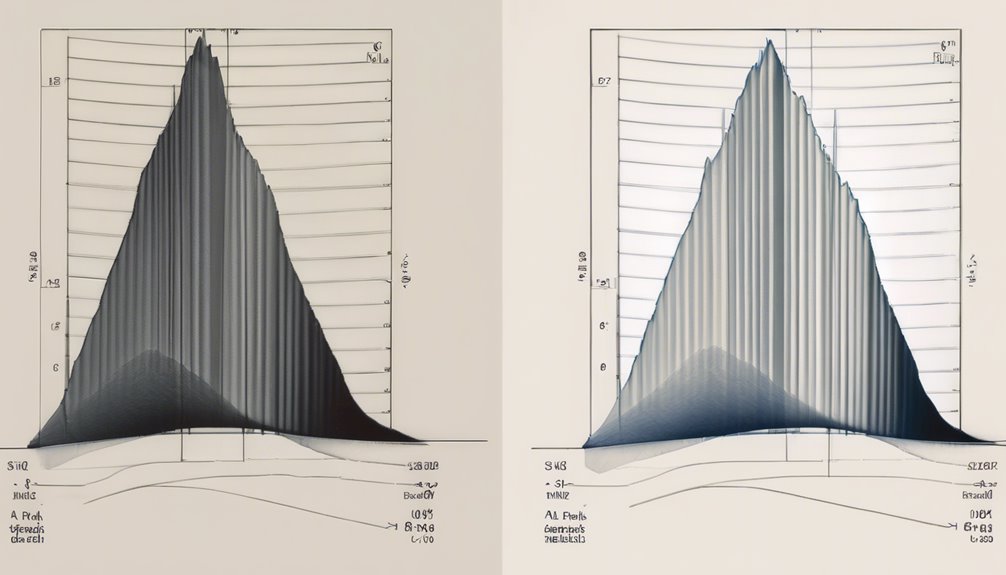
Visual Representation of Skewed Distributions
Visualizing skewed distributions can greatly enhance your understanding of data behavior. When you create histograms or box plots, you can easily spot whether your data is left or right skewed.
In a right-skewed distribution, the tail extends to the right, indicating that larger values are less frequent. Conversely, in a left-skewed distribution, the tail stretches to the left, showing that smaller values are rarer.
Using these visual tools allows you to quickly assess the shape of your data and identify outliers. Additionally, layering a normal distribution curve over your histogram can provide a clear comparison, highlighting how your data diverges from normality.
Engaging with these visuals helps you grasp the nuances of skewness effectively.
Implications of Skewness in Data Analysis
Understanding the visual representation of skewed distributions lays the groundwork for recognizing their implications in data analysis. Skewness affects your interpretation of data, influencing decisions and predictions.
When you encounter a left-skewed distribution, it often suggests that most data points are concentrated on the higher end, which may lead to underestimating certain risks or outcomes. Conversely, a right-skewed distribution indicates a concentration on the lower end, potentially skewing your analysis toward overestimating the frequency of extreme values.
Recognizing these patterns helps you choose appropriate statistical methods, ensuring accurate conclusions. By understanding skewness, you can refine your modeling techniques, enhance data interpretation, and avoid misleading results, ultimately driving better decision-making.
Examples of Left and Right Skewed Distributions in Real Life
Skewed distributions appear in various real-life scenarios, offering valuable insights into the underlying data. For instance, income distribution often shows a right skew, where a small number of individuals earn significantly higher incomes than the majority. This highlights income inequality.
On the other hand, the age at retirement can exhibit a left skew; many people retire around a certain age, but a few retire much earlier. Similarly, the distribution of exam scores can be right skewed if most students perform well but a few score very low.
Recognizing these patterns helps you understand trends and make informed decisions, whether in economics, education, or health. Each scenario illustrates how skewness affects interpretation and analysis of data.
Statistical Measures of Skewness

When analyzing data, skewness plays a crucial role in understanding its distribution. You can measure skewness using several statistical methods, with the most common being Pearson's Skewness Coefficient and the standardized third moment.
Pearson's method calculates skewness based on the mean and mode, providing insight into the direction and degree of skew. The third moment, calculated using the formula involving the mean and standard deviation, gives a more nuanced view of asymmetry.
A skewness value of zero indicates a perfectly symmetrical distribution, while positive or negative values indicate right or left skewness, respectively. By understanding these measures, you can better interpret data trends and make informed decisions based on the underlying distribution.
Conclusion
In summary, understanding left and right skewed distributions is essential for effective data analysis. Recognizing the characteristics of each type helps you interpret data more accurately and make informed decisions. Whether you're dealing with financial data, test scores, or any other set of numbers, being aware of skewness can reveal underlying trends and patterns. By applying this knowledge, you can enhance your analytical skills and improve your insights into the data you encounter.