

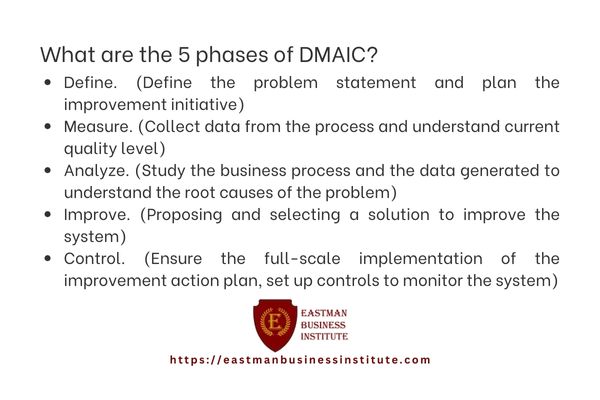
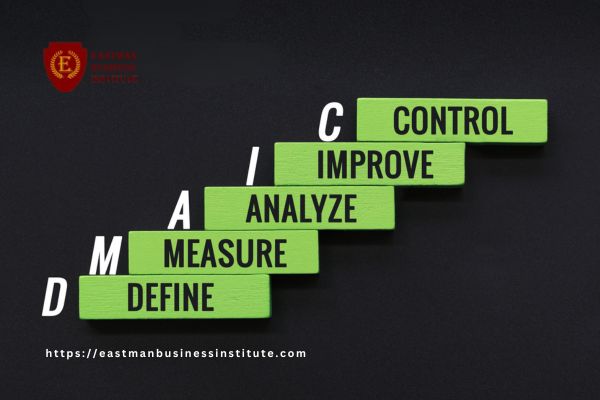
DMAIC stands for Define, Measure, Analyze, Improve, and Control. It is a five-phase, data-driven Lean Six Sigma method for improving an existing process. Teams use DMAIC to define a measurable problem, establish current performance, find root causes, implement verified improvements, and create controls that keep the gains from slipping away.
DMAIC is a data-driven methodology within Six Sigma that uses five phases—Define, Measure, Analyze, Improve, and Control—to reduce process variation and enhance quality and efficiency. It provides a structured pathway for continuous improvement, helping organizations optimize operations and meet customer expectations.
What Does DMAIC Stand For?
DMAIC stands for Define, Measure, Analyze, Improve, and Control. It is one of the most widely used problem-solving frameworks in Six Sigma and Lean Six Sigma because it gives improvement teams a disciplined path from a business problem to a sustained result. Instead of jumping immediately to a solution, DMAIC requires the team to clarify the problem, collect reliable data, identify root causes, test improvements, and then hold the improved process in place.
DMAIC is best suited to an existing process that is not meeting customer, quality, cost, speed, or reliability requirements. Examples include excessive defects, long turnaround time, late deliveries, recurring rework, high scrap, customer complaints, billing errors, or variation in a manufacturing or service process. The method is especially valuable when the cause of the problem is not already known and the solution needs to be supported by evidence. The five letters form a sequence, but DMAIC is not meant to be a paperwork exercise. Each phase should answer a practical question: What problem are we solving? How is the process performing now? Why is the problem happening? What change actually improves the result? How will we sustain that result? A project should not move forward simply because a checklist is complete; it should move forward because the evidence required for the next decision is available.
The 5 Phases of DMAIC Explained
Define
The Define phase establishes the business case and the boundaries of the project. The team describes the problem in measurable terms, identifies the customer or stakeholder affected, clarifies what is in and out of scope, and agrees on the desired outcome. A project charter often captures the problem statement, goal statement, scope, timeline, team members, and expected benefits.
Good Define work prevents teams from solving the wrong problem. Instead of saying “customer service is slow,” a stronger problem statement might say that 28% of support tickets exceed the 24-hour response target. Voice of the Customer (VOC), SIPOC diagrams, stakeholder analysis, and high-level process maps are common tools in this phase.
Measure
The Measure phase establishes the current state. The team decides what must be measured, checks whether the measurement system is trustworthy, collects baseline data, and quantifies current process performance. The goal is to replace assumptions with evidence and create a baseline against which improvement can later be judged.
Measures might include defect rate, cycle time, turnaround time, first-pass yield, downtime, queue length, cost per transaction, or customer wait time. Depending on the project, teams may use a data collection plan, operational definitions, check sheets, process capability analysis, Pareto charts, or measurement system analysis. A weak baseline makes later claims of improvement difficult to defend.
Analyze
The Analyze phase identifies and verifies the causes that drive the performance gap. Teams examine the measured data and the process itself to separate symptoms from root causes. Common techniques include process mapping, Pareto analysis, fishbone diagrams, the 5 Whys, stratification, scatterplots, hypothesis testing, regression, and other statistical methods appropriate to the data.
The key word is verify. A brainstorming session may generate possible causes, but DMAIC calls for evidence before the team commits resources to a solution. If long turnaround time appears to be caused by understaffing, for example, analysis may show that the larger driver is actually batching, rework, or a handoff that sits in queue for hours.
Improve
The Improve phase develops, tests, and implements solutions that address verified root causes. The team generates alternatives, evaluates risk, pilots promising changes, and compares post-change results with the baseline. The purpose is not merely to make a change; it is to demonstrate that the change produces the intended improvement without creating unacceptable new problems elsewhere in the process.
Typical Improve tools include brainstorming, prioritization matrices, design of experiments, mistake-proofing (poka-yoke), FMEA, pilot testing, workflow redesign, standard work, and Lean techniques that reduce waste or unnecessary handoffs. Where practical, teams test on a limited scale before full deployment.
Control
The Control phase makes the improved process sustainable. Responsibilities are transferred to process owners, new procedures are standardized, staff are trained, critical measures are monitored, and response plans are defined for signals that performance is deteriorating. Control charts, dashboards, audits, checklists, visual management, standard operating procedures, and documented control plans are common outputs.
A DMAIC project is not successful if performance improves for only a few weeks and then drifts back to the original state. Control closes that gap by defining who watches the process, what metric is monitored, how often it is reviewed, what limits or thresholds matter, and what action should occur when the process moves out of control.
DMAIC Step by Step: A Real-World Example
Suppose a distribution company has a chronic late-shipment problem. Customers expect orders to leave the warehouse within 24 hours, but only 68% currently meet that target. Management could immediately add labor or buy equipment, but DMAIC first asks the team to understand the process and prove what is driving delay.
1. Define the problem
The team writes a project charter with a goal of increasing the percentage of orders shipped within 24 hours from 68% to at least 90% within four months. The scope begins when an order is released to the warehouse and ends when the carrier scans it as shipped. The team identifies customers, warehouse operations, inventory control, and transportation as key stakeholders.
2. Measure current performance
For several weeks, the team records order release time, picking start time, picking completion, packing, staging, carrier pickup, order size, shift, product family, rework, and exceptions. A process map shows where orders wait. Operational definitions ensure that “late” and “complete” mean the same thing to everyone. The baseline confirms the 68% on-time level and reveals that waiting time, rather than hands-on processing time, dominates total elapsed time.
3. Analyze the causes
A Pareto chart shows that most late shipments come from two product families. A fishbone diagram and 5 Whys generate possible causes, but further analysis finds that those products frequently arrive at picking without a complete location assignment. Orders then wait for manual inventory research. The team also discovers that large batches released at fixed times create predictable queue spikes.
4. Improve the process
The team pilots automatic location validation before order release and replaces two large release batches with smaller, more frequent waves. An FMEA is used to anticipate failure modes in the redesigned workflow. During the pilot, the percentage shipped within 24 hours rises to 93%, while picking accuracy remains stable. Because the data support the change, the new workflow is expanded to the full operation.
5. Control the gains
The process owner receives a control plan that tracks the on-time shipment percentage, location-assignment exceptions, and daily queue age. A control chart is reviewed weekly, and an escalation rule is triggered if exceptions exceed a defined threshold. Standard work and training are updated, and the project team schedules a 30- and 90-day review to confirm that the improvement is holding.
This example shows why DMAIC is stronger than “fix what seems wrong.” The team did not assume that labor was the cause. It measured the process, verified the actual drivers, tested countermeasures, and built monitoring into the new way of working.
DMAIC vs. DMADV: When to Use Each
DMAIC and DMADV are both structured Six Sigma methodologies, and their first three phases share the same names: Define, Measure, and Analyze. Their purposes diverge after that point. DMAIC improves an existing process through Improve and Control. DMADV — Define, Measure, Analyze, Design, and Verify — is generally used when a new product, service, or process must be designed, or when the existing process is so inadequate that incremental improvement is not the right answer.
| Decision Point | DMAIC | DMADV |
| Primary purpose | Improve an existing process | Design a new process, product, or service |
| Five phases | Define, Measure, Analyze, Improve, Control | Define, Measure, Analyze, Design, Verify |
| Use when | A current process exists but performance is inadequate | A new design is needed or the existing process cannot meet requirements |
| Typical question | How do we reduce defects or variation in what we already do? | How should we design this so it meets requirements from the start? |
| End state | Improved process with controls | Verified design ready for implementation or launch |
A practical selection rule is simple: if the process exists and can reasonably be improved, start with DMAIC. If the project requires a fundamentally new design, consider DMADV. The decision should be based on the nature of the problem, not on which acronym the team prefers.
DMAIC vs. PDCA
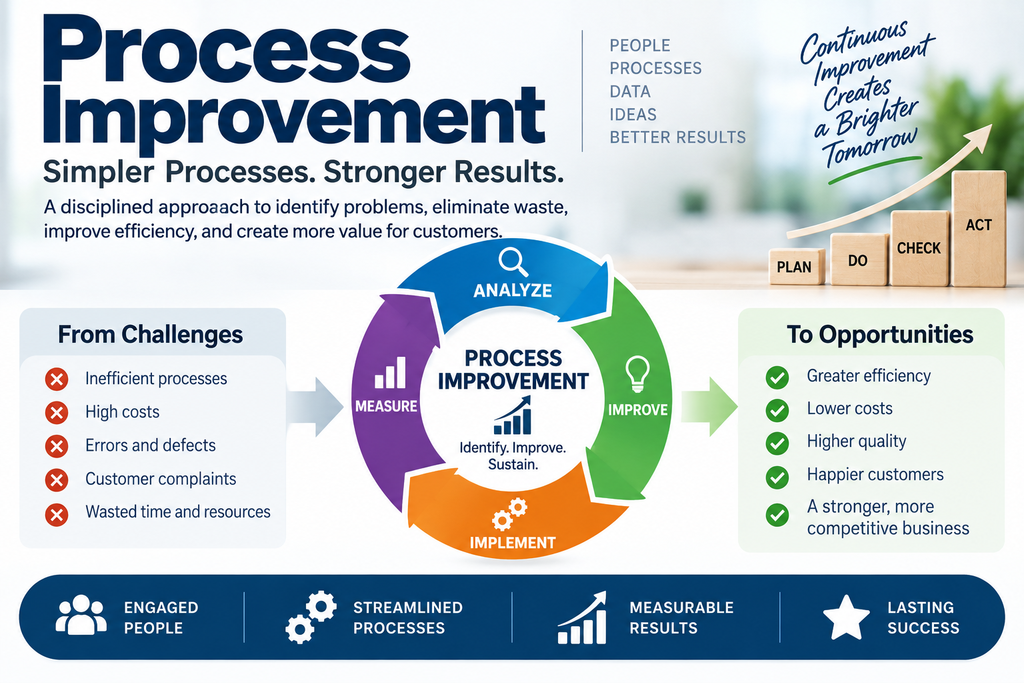
DMAIC and PDCA are both improvement cycles, but they differ in structure and typical use. PDCA — Plan, Do, Check, Act — is a broadly applicable iterative cycle for testing and standardizing change. DMAIC is a more explicitly data-driven project roadmap associated with Six Sigma and usually provides greater emphasis on baseline measurement, root-cause verification, statistical analysis, and formal control of the improved process.
PDCA can be useful for rapid or recurring improvement cycles where the problem and test can be handled with a lighter structure. DMAIC is often a better fit for complex, chronic, cross-functional problems where causes are uncertain and the team needs a disciplined analytical sequence. Neither method is universally “better”; the right choice depends on the complexity, risk, data needs, and scale of the problem.
Related guide: DMAIC vs. PDCA: Key Differences and When to Use Each
DMAIC Tools by Phase
DMAIC is a framework, not a fixed toolbox. Teams should use the simplest tools that answer the question in front of them. A fishbone diagram, control chart, and FMEA are useful examples, but no project needs every Six Sigma tool.
| DMAIC Phase | Common Tools | What the Tools Help Answer |
| Define | Project charter, VOC, CTQ tree, SIPOC, stakeholder analysis | What problem matters, to whom, and within what scope? |
| Measure | Process map, data collection plan, MSA, check sheet, Pareto chart, capability analysis | How does the process perform now, and can we trust the data? |
| Analyze | Fishbone diagram, 5 Whys, Pareto analysis, scatterplot, hypothesis tests, regression | Which causes actually drive the problem? |
| Improve | Brainstorming, prioritization matrix, DOE, poka-yoke, pilot testing, FMEA | Which solution best addresses verified causes, and what risks could it introduce? |
| Control | Control charts, control plan, dashboards, standard work, audits, response plans | How will the team detect drift and sustain the new level of performance? |
Fishbone diagrams
A fishbone, or cause-and-effect, diagram is most often used during Analyze to organize possible causes into logical categories such as people, methods, machines, materials, measurement, and environment. Its strength is structured brainstorming; its limitation is that it does not prove a cause. Suspected causes still need to be tested with process evidence or data.
Control charts
Control charts are especially useful in Measure and Control. They show process behavior over time and help distinguish common-cause variation from signals that may indicate a special cause. In Control, a chart can act as an early-warning system so the process owner responds before performance fully deteriorates.
FMEA
Failure Mode and Effects Analysis helps teams anticipate how a process or proposed change could fail, evaluate the risk, and prioritize prevention or mitigation. It is particularly useful during Improve and during handoff to Control because it encourages teams to address risk before the new method becomes standard work.
Common DMAIC Mistakes
Starting with the solution
One of the most common mistakes is writing the project around a preferred fix: “implement automation,” “add staff,” or “buy a new machine.” DMAIC should begin with a measurable performance problem. The solution belongs later, after causes have been verified.
Using vague problem and goal statements
Statements such as “quality is poor” or “reduce delays” do not provide a usable target. Strong DMAIC projects identify the metric, current performance, desired performance, affected process, and relevant time frame. Specific goals make scope and success easier to manage.
Collecting data without operational definitions
If team members measure a defect, delay, or completed transaction differently, the dataset can create false conclusions. Define what counts, where measurement begins and ends, how exceptions are handled, and which source is authoritative before collecting large amounts of data.
Treating a fishbone diagram as proof
Cause-and-effect diagrams and brainstorming produce hypotheses, not verified root causes. A team that selects a cause because it sounds plausible can spend weeks improving something that has little effect. Analysis should connect causes to observed process behavior.
Skipping the pilot
A full-scale implementation increases risk when the solution has not been tested. A pilot can reveal unintended consequences, training problems, capacity constraints, or measurement issues while the change is still easier to adjust.
Ending the project after Improve
The Control phase is often rushed because the visible problem appears solved. Without a control plan, ownership, monitoring, documented standards, and a response strategy, old habits and process drift can erase the gains. Sustainable improvement is part of the DMAIC result, not an optional follow-up.
Conclusion
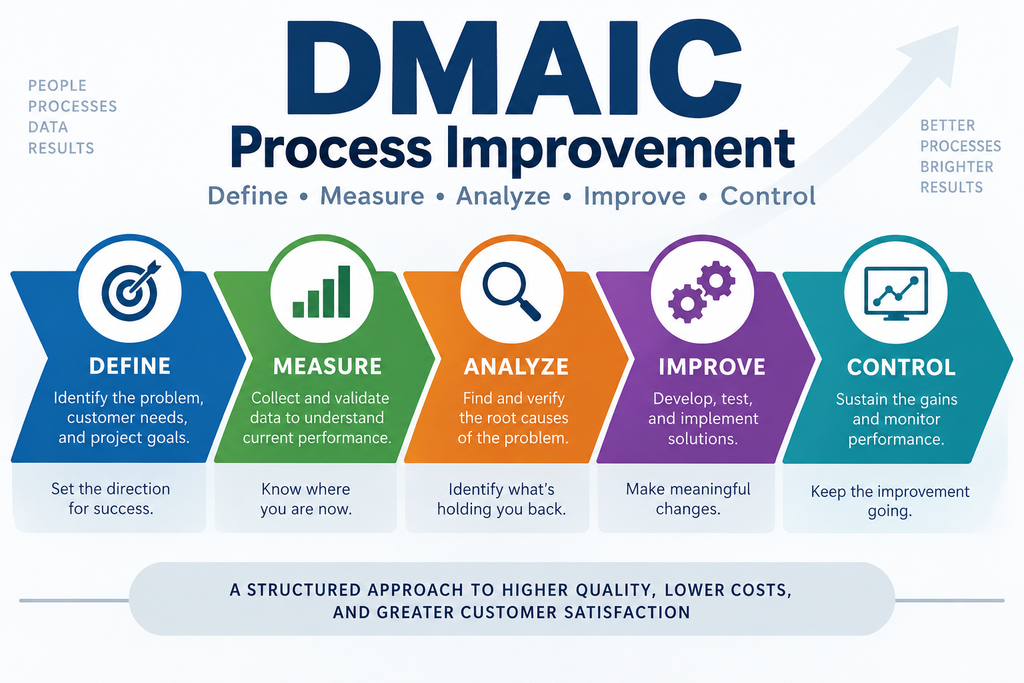
DMAIC gives improvement teams a disciplined way to move from a recurring problem to a controlled result. Define establishes the problem and goal; Measure creates a reliable baseline; Analyze identifies verified root causes; Improve tests and implements solutions; and Control makes the new performance sustainable. The framework is most powerful when teams resist the urge to jump to conclusions and instead let data guide each decision. For existing processes that need measurable improvement, DMAIC remains one of the clearest and most practical roadmaps in Lean Six Sigma.
Frequently Asked Questions
What does DMAIC stand for?
DMAIC stands for Define, Measure, Analyze, Improve, and Control. It is the five-phase Six Sigma methodology for improving existing processes. Define scopes the problem and the project charter. Measure captures baseline performance and identifies key metrics. Analyze finds the root causes of variation. Improve tests and implements solutions. Control locks in the gains through monitoring, standard work, and updated procedures.
What are the 5 phases of DMAIC?
The five phases of DMAIC are Define, Measure, Analyze, Improve, and Control. Define sets the problem statement, scope, team, and business case. Measure collects baseline data on the process and validates the measurement system. Analyze identifies root causes through statistical analysis and process mapping. Improve designs, tests, and implements solutions. Control puts long-term monitoring and standardization in place so the improvement holds.
What is the difference between DMAIC and DMADV?
DMAIC is used to improve an existing process, while DMADV is used to design a new process or product. DMAIC’s phases are Define, Measure, Analyze, Improve, Control. DMADV’s phases are Define, Measure, Analyze, Design, Verify. Use DMAIC when a process exists but is underperforming. Use DMADV when no process exists or when existing processes cannot be improved to meet the required Six Sigma quality level.
What is the difference between DMAIC and PDCA?
DMAIC is a Six Sigma methodology with five formal phases and heavy statistical tooling. PDCA (Plan-Do-Check-Act) is Deming’s simpler four-step continuous improvement cycle used across quality management. DMAIC is more rigorous and data-driven, typically used for defined projects with charters and deliverables. PDCA is lighter and used for iterative day-to-day improvements. Both share the underlying idea of measurement, analysis, and iterative improvement.
What tools are used in DMAIC?
DMAIC uses different tools in each phase. Define uses project charters and SIPOC diagrams. Measure uses process mapping, data collection plans, and measurement system analysis (MSA). Analyze uses fishbone diagrams, Pareto charts, hypothesis testing, and regression. Improve uses design of experiments (DoE), FMEA, and pilot testing. Control uses control charts, standard operating procedures, and process monitoring plans.
How long does a DMAIC project take?
A typical DMAIC project takes 3 to 6 months for a Green Belt project and 6 to 12 months for a Black Belt project. The exact duration depends on process complexity, data availability, and organizational readiness. Green Belt projects usually address a single sub-process with well-defined boundaries. Black Belt projects tackle cross-functional issues or ones requiring statistical analysis, so they naturally take longer.